Making RICON map-ready
25 September 2026
In 2020 I published RICON, a graph of how dams and streamgages are connected by rivers. I built it for the Colorado River Basin and later extended it across the contiguous US. It answers one question: which downstream gauge or reservoir is connected, through the river network, to a given upstream dam or gauge? The connections come from the flow directions in the national hydrography dataset (NHDPlusV2), not from statistical similarity between catchments. Until now, RICON has been a set of CSV files: dams, gauges, and an edge list with the river distance between each connected pair.
Why revisit it now
In June, Google open-sourced OpenHydroNet, the modeling framework behind Flood Hub. It builds on NeuralHydrology, an open-source library for machine-learning hydrology, and includes Flood Hub’s current and previous forecasting models. Both are LSTMs, neural networks designed for time series. The framework is set up to train on Caravan (Kratzert et al., 2023), a global dataset of streamflow records and catchment attributes. The earlier model is the one behind the 2024 Nature paper showing that one globally trained model can forecast floods in basins that have never had a gauge.
There’s also an open question about whether river connections help these models. Most flood models, Flood Hub’s included, treat each gauge on its own. Graph neural networks can instead pass information between gauges along the river network. Kirschstein and Sun (2024) tested this on LamaH-CE (Klingler et al., 2021), a public dataset of about 860 gauges in Austria and the upper Danube. Adding the river network didn’t improve the forecasts. Wang et al. (2025), using the same dataset, traced this kind of result to “over-squashing.” Like a message passed down a long line of people, information from far upstream gets diluted as it moves one link at a time and merges at each confluence. When they added direct links between every pair of gauges connected by flow, their 24-hour forecasts were as accurate as a standard LSTM’s 14-hour forecasts: about ten hours of extra warning. So river structure helps when the graph is designed around a specific problem, not simply because it’s physically real.
Neither study’s graph includes dams. In RICON, dams are nodes in their own right, the points where operations change downstream flow. I think that layer is missing from the discussion.
What I built
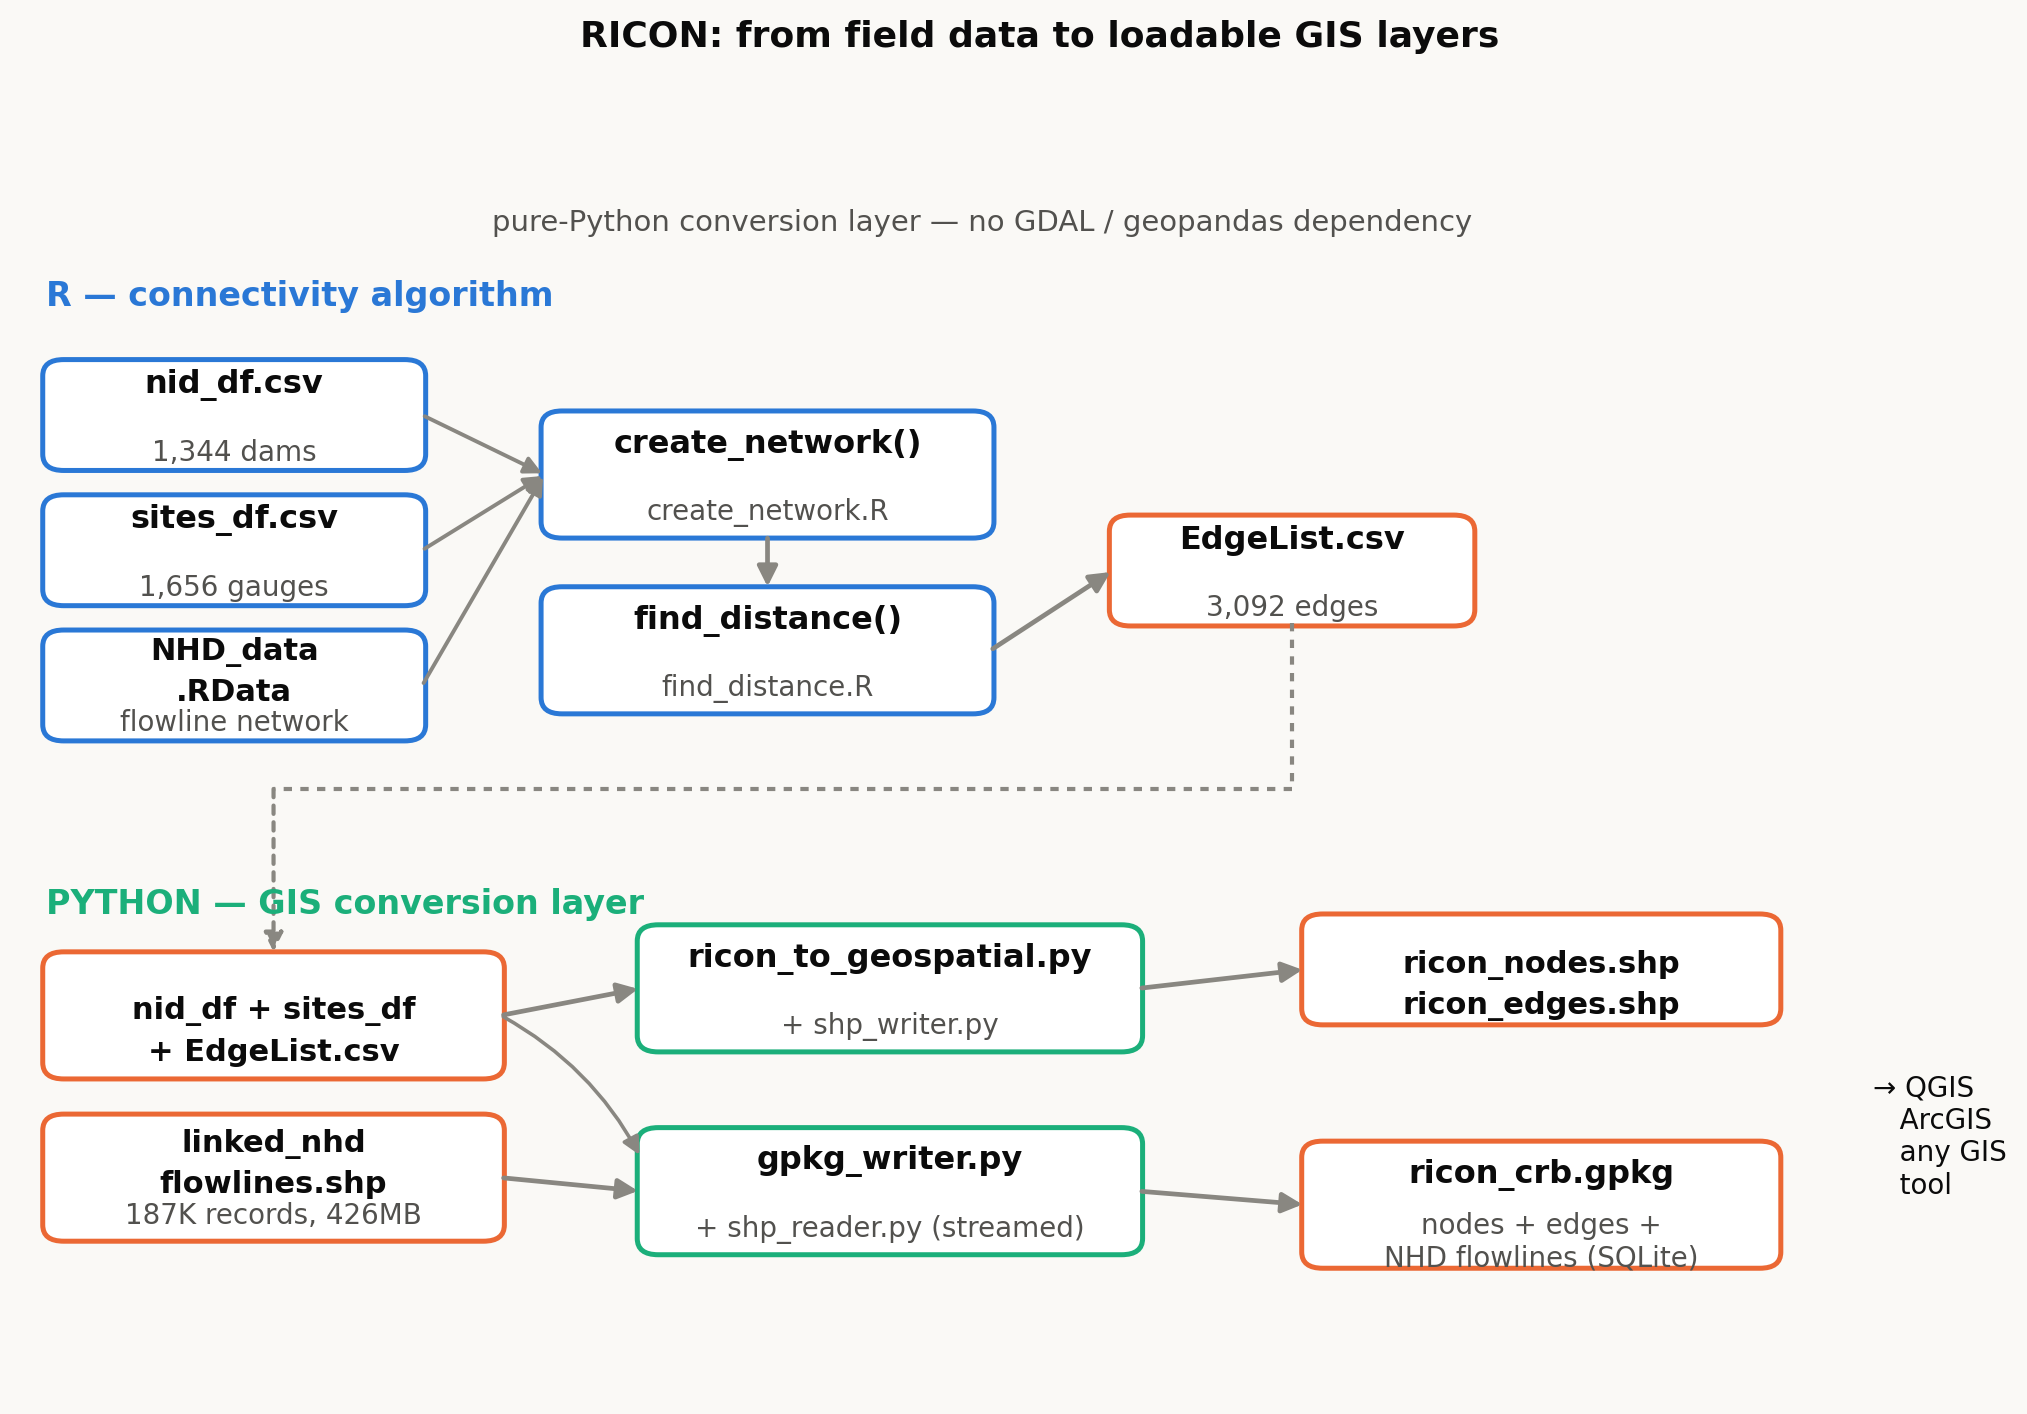
This year I wrote a conversion layer that turns RICON’s output for
the Colorado River Basin (1,344 dams, 1,656 gauges, 3,092 edges) into
shapefiles and a GeoPackage that QGIS, ArcGIS or any GIS tool can open.
It’s pure Python, with no GDAL or geopandas dependency. The GeoPackage
is the main output, because shapefiles cut column names to 10
characters. It’s written directly with SQLite, with the
application_id set so GIS software recognizes it. The 426
MB NHD flowline attribute table is streamed rather than loaded into
memory.
The latest version of the codes is here.
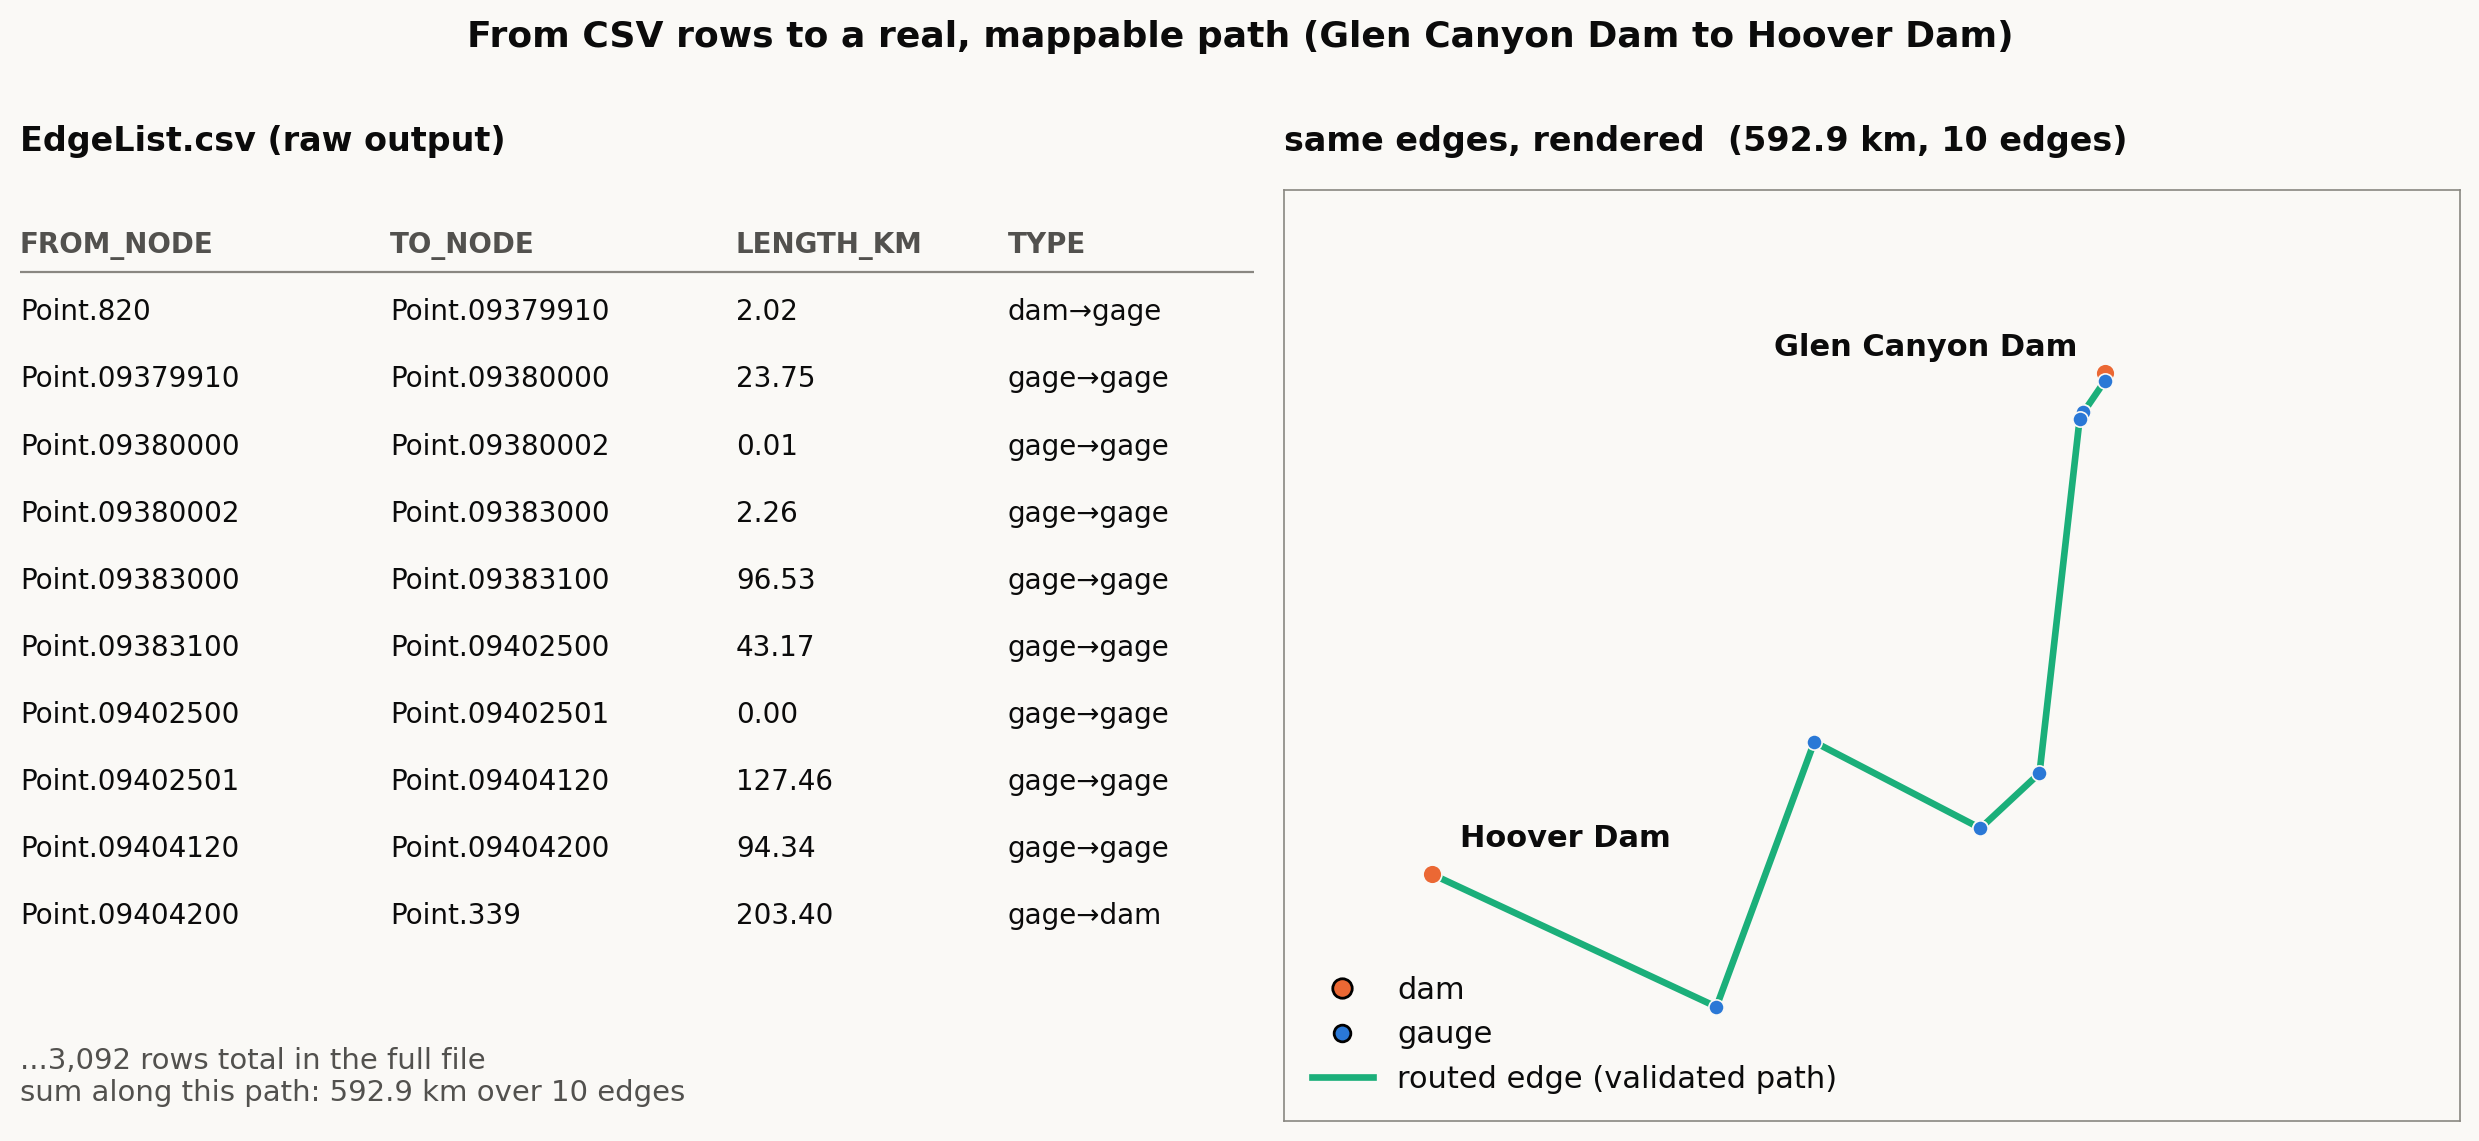
As a first check, the Glen Canyon Dam to Hoover Dam distance came out at 592.9 km, the same value the 2020 paper reported.
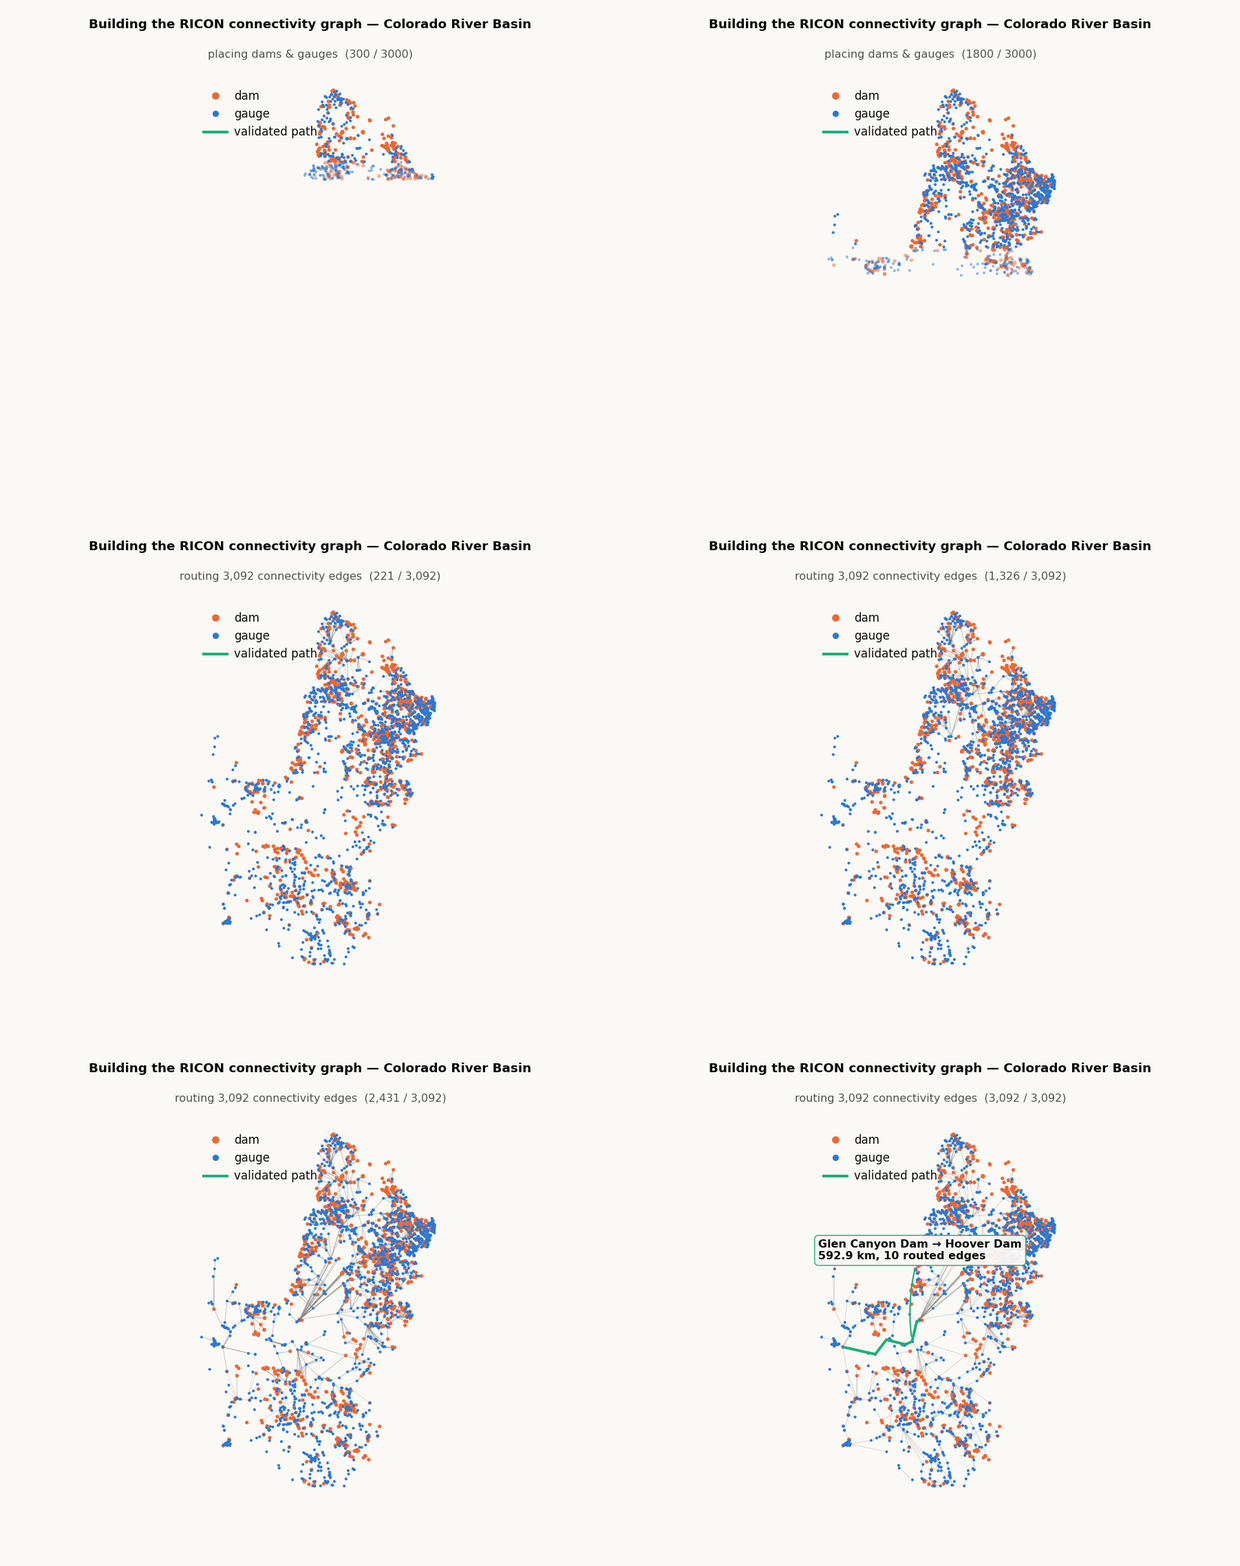
What’s next
I don’t know yet whether a graph with dams in it would improve a topology-aware forecasting model, or whether dam-regulated rivers are where catchment-similarity models miss the most. But the data can now be used to test that.
One path along the mainstem doesn’t check 3,092 edges, though. If a graph is going to feed a model, it should be checked like a model. The next post covers how I checked the rest. [Coming soon...]